
I'm liquidating my stocks and going to cash
2019 Mar 28, 10:56am 5,363 views 73 comments
« First « Previous Comments 34 - 73 of 73 Search these comments
36
EBGuy
2019 Mar 28, 5:21pm
Heraclitusstudent says
I don't disagree, but most of the refund checks haven't been sent out yet. Plenty of non-coastal folks will be getting money back. More sugar to get us through the next election cycle. At this point, though, the tax code is loaded with buried IEDs. Almost unfixable as the Dems (or responsible adults in Congress) will have to argue for tax increases at the same time that they advocate for tax cuts (dispensing with SALT limits) for the coastal elites. This situation is nearly unfixable, so when the house of cards comes down it will blow out spectacularly.
Trump's tax cut is spent too. Sugar high.
I don't disagree, but most of the refund checks haven't been sent out yet. Plenty of non-coastal folks will be getting money back. More sugar to get us through the next election cycle. At this point, though, the tax code is loaded with buried IEDs. Almost unfixable as the Dems (or responsible adults in Congress) will have to argue for tax increases at the same time that they advocate for tax cuts (dispensing with SALT limits) for the coastal elites. This situation is nearly unfixable, so when the house of cards comes down it will blow out spectacularly.
37
Heraclitusstudent
2019 Mar 28, 5:27pm
I dislike "technical analysis" but this is one chart is fucking ugly:

38
 CBOEtrader
2019 Mar 28, 7:03pm
CBOEtrader
2019 Mar 28, 7:03pm
EBGuy says
Are you calling for a dollar crash? Are you loaded up on mortgages?
Perhaps an XRP play if you really think the global exchange system could collapse
This situation is nearly unfixable, so when the house of cards comes down it will blow out spectacularly.
Are you calling for a dollar crash? Are you loaded up on mortgages?
Perhaps an XRP play if you really think the global exchange system could collapse
39
 Shaman
2019 Mar 28, 7:23pm
Shaman
2019 Mar 28, 7:23pm
Heraclitusstudent says
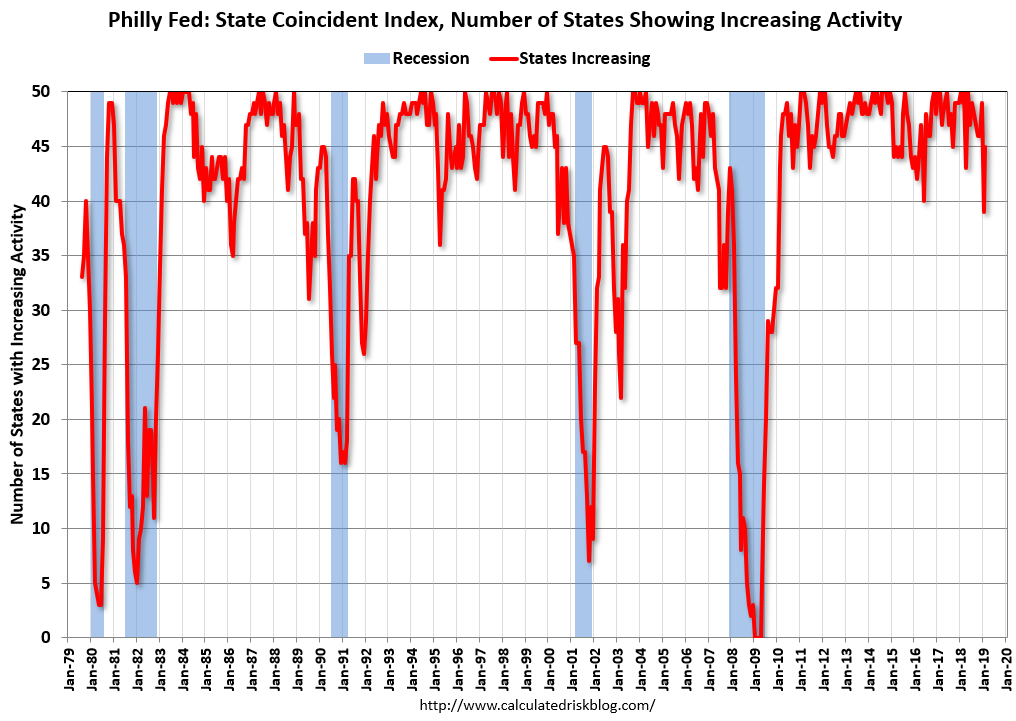
To me this looks like a trailing indicator. By January 2009, the stock markets had reached close to their low points after falling all 2008. The nadir is after January. So honestly, this would be shit for predictive value. Looking back, the 2001 nadir wasn’t predictive either.
If anything, the bottom on this graph would indicate that there’s six months until the recovery.
Appendix A: In 7 out of 9 past times this indicator fell to 0, recession ensued.

To me this looks like a trailing indicator. By January 2009, the stock markets had reached close to their low points after falling all 2008. The nadir is after January. So honestly, this would be shit for predictive value. Looking back, the 2001 nadir wasn’t predictive either.
If anything, the bottom on this graph would indicate that there’s six months until the recovery.
40
 AD
2019 Mar 28, 8:36pm
AD
2019 Mar 28, 8:36pm
Heraclitusstudent says
Yes, basically the S&P 500 has moved sideways for the last 14 months. Notice the S&P 500 moved sideways for about 12 months prior to the late 2008 crash.
Seems like not much left to keep the market propped up around 2800 points for S&P 500. And technically the market was in a bear market back on December 24 when the S&P 500 was down 20% from its recent peak, as well as the other major indices below 20% of their recent peaks.
I dislike "technical analysis" but this is one chart is fucking ugly:
Yes, basically the S&P 500 has moved sideways for the last 14 months. Notice the S&P 500 moved sideways for about 12 months prior to the late 2008 crash.
Seems like not much left to keep the market propped up around 2800 points for S&P 500. And technically the market was in a bear market back on December 24 when the S&P 500 was down 20% from its recent peak, as well as the other major indices below 20% of their recent peaks.
41
Heraclitusstudent
2019 Mar 28, 11:12pm
Quigley says
We are probably not at the bottom, and we probably already passed the stock market peak.
But you are right. I wouldn't bet anything based on this indicator.
Rather my reasons are the exhaustion of the current expansion:
- housing is exhausted
- the unemployment pool is exhausted
- the tax break is exhausted.
- The feds already raised rate enough to inverse the yield curve.
The slightest slowdown now will build on itself: you will see more layoffs, sentiment and spending will go down, etc, etc...
No financial crisis this time around - in the US at least.
If anything, the bottom on this graph would indicate that there’s six months until the recovery.
We are probably not at the bottom, and we probably already passed the stock market peak.
But you are right. I wouldn't bet anything based on this indicator.
Rather my reasons are the exhaustion of the current expansion:
- housing is exhausted
- the unemployment pool is exhausted
- the tax break is exhausted.
- The feds already raised rate enough to inverse the yield curve.
The slightest slowdown now will build on itself: you will see more layoffs, sentiment and spending will go down, etc, etc...
No financial crisis this time around - in the US at least.
42
 cmdrda2leak
2019 Mar 29, 7:44am
cmdrda2leak
2019 Mar 29, 7:44am
Alternative viewpoint:
Yield Curve Inversion Suggests New All-Time Highs For Stocks


https://seekingalpha.com/article/4251345-yield-curve-inversion-suggests-new-time-highs-stocks?ifp=0
Yield Curve Inversion Suggests New All-Time Highs For Stocks
As most readers of this article are probably aware, the 10-year minus 3-month US Treasury yield curve has recently "inverted." There has been a flood of commentary in the financial media (including over 20 articles on Seeking Alpha) with pundits claiming that this inversion "signal" portends an imminent recession in the US and that this forthcoming recession portends an associated major decline in the stock market.
At the very outset of this article, I want to make it clear that my detailed research suggests that the 10Y-3M yield curve is not a good predictor of recessions. Nor is it a good indicator of draw-down risk in an investment portfolio.
This signal extracted from this particular yield curve, based on inversion, generated some false positives in the mid-1960s, many false positives all throughout the 1980s and 1990s, and a false positive around 2005. Furthermore, using inversions of this yield curve as a "sell" signal in an asset allocation model would have produced many trading "whipsaws" and poor investment performance.
So which, if any, yield curve should be used for purposes of recession forecasting? Many different yield curves - there are hundreds of possible maturity combinations that can be used - could be used to extract a recession signal that is derived from inversion of that particular curve. As it turns out, researchers have discovered that inversion of the 10Y-3M yield curve has apparently been - and I use this term intentionally - a pretty good lead indicator of recessions.
Proponents of the 10Y-3M yield curve inversion signal frequently claim that this indicator has predicted 7 out of the last 7 recessions. While this statement is arguably accurate, it can be a bit misleading unless it is qualified. First of all, using daily price data, the 10Y-3M yield curve produced a false negative in the late 1950s. Second, as can be seen from Figure 2 above, the 10Y-3M yield curve inversion signal produced false positives in 1966, 1998, and early 2006. If these four failures were taken into account, the track record of the 10y-3M yield curve inversion signal would only be 4 of 8. Proponents of the 10Y-3M inversion signal generally suppress the latter two false positives by using monthly or quarterly data. Although this practice is questionable, for purposes of this article, we will go along with this assumption. Using these criteria, the 10Y-3M inversion signal has a track record of 6 out of 8 - and 6 out of the last 6. This seems like a reasonably good track record for a leading indicator, from a purely statistical point of view.
But there is a critical question that is rarely if ever asked: Is there any solid theoretical or conceptual basis for using the 10Y-3M yield curve to forecast recessions? Is there any solid theoretical or conceptual basis for preferring this yield curve to any other yield curve? The answer to this question is: No, there isn't. As I will be discussing at length in Successful Portfolio Strategy in the next few days and weeks, from a conceptual point of view, there is very little theoretical or conceptual support for using yield curves at all to predict recessions. Furthermore, to the extent that yield curves are used at all for predicting recessions, there is definitely good conceptual reasons to use yield curves other than the 10Y-3M.
[...]
What Has Historically Happened to The Economy and Stocks After the 10Y-3M Yield Curve Inverts?
Although there is little or conceptual justification for using the 10Y-3M yield curve as a basis for predicting recessions within a 6-to-18-month timeframe, we will play dumb for now and simply take this indicator at face value in the way that it is employed by most of its proponents - i.e. as a leading indicator of recessions. What has historically happened in each of the last 8 business cycles after the first inversion of the 10Y-3M yield curve? Note that we use monthly data in Figure 3 below in order to filter out false positives in 1998 and early 2006.
Let's first look at what has historically occurred to the economy after the 10Y-3M yield curve has registered its first inversion of the business cycle. The first thing to note is that the range of outcomes is quite wide. From the date of the first yield curve inversion in a cycle until recession, the time elapsed ranges from 4 years to 6 months. Including only the past 6 cycles, the range is 17 to 6 months.
Now, let's look at what has historically occurred to stocks during this time. The first thing to observe is that cyclically-associated bull markets tend to continue trend higher for some time after the inversion of the 10Y-3M yield curve. The median time from the inversion until the end of the cyclically-associated bull market (and the start of a cyclically-associated major drawdown) was about 11 months. The median upside of the S&P 500 until the peak of the cyclically-associated bull market cycle is reached was 16.03% (not including dividends).
The implication that can be derived from this analysis of the historical data is that a yield curve inversion does not signal an immediate end to the US economic expansion. Most importantly, the inversion does not signal an immediate end of an ongoing cyclically-associated bull market. Indeed, historical precedent suggests that after an inversion of the 10Y-3M yield curve, the S&P 500 is likely to register fairly significant upside until the peak of the cyclically-associated bull market is reached.
[...]
However, if one believed that the 10Y-3M inversion signal was significant, and took it at face value, this is how I would go about thinking about how to apply it to the present situation:
The data on yield curve inversions is divided into two categories: A) Yield curve inversions that happened before major cyclically-associated drawdowns; B) Yield curve inversions that happened after major cyclically-associated drawdowns. As stated earlier, major cyclically associated drawdowns have always occurred after the 10y-3M yield curve has inverted - unless there has been a major macroeconomically significant shock which has imperiled the economic expansion.
[...]
Relating this to present circumstances, it should be noted that there have been no major macroeconomically significant shocks that have imperiled the ongoing business cycle (and which the yield curve failed to properly discount). Therefore, the current situation of the US stock market most likely falls under the first category of yield curve inversions - the US stock market is in a situation in which the end of the cyclically associated bull market is likely to occur significantly after the 10Y-3M yield curve has inverted.
How much after the inversion of the 10Y-3M can we expect the current cyclically associated bull market to end? Based only on the historical experiences with yield curve inversions, a reasonable expectation would be about 11 months, with a pretty wide margin of error.
[...]
https://seekingalpha.com/article/4251345-yield-curve-inversion-suggests-new-time-highs-stocks?ifp=0
43
Heraclitusstudent
2019 Mar 29, 9:50am
The articles you get for free are often there to herd you into buying or selling.
At the top of the market they usually sounding like:
"CSCO is a much better buy than ORCL: look at the numbers.". (implicit: you should be buying)
"The yield curve inverts? Don't worry, this is not a good predictor."
Nothing that is free is on your side.
At the top of the market they usually sounding like:
"CSCO is a much better buy than ORCL: look at the numbers.". (implicit: you should be buying)
"The yield curve inverts? Don't worry, this is not a good predictor."
Nothing that is free is on your side.
44
clambo
2019 Mar 29, 3:07pm
Cash is for paying for immediate emergencies, fun money, vice money and bait for females.
I'll never get out of stocks unless and until I see Warren Buffet sell everything.
Dividend paying stocks will always be OK; when will people give up using soap and shampoo, gasoline, fast food, cell phone service, cable TV, electricity, credit cards and banks?
I'll never get out of stocks unless and until I see Warren Buffet sell everything.
Dividend paying stocks will always be OK; when will people give up using soap and shampoo, gasoline, fast food, cell phone service, cable TV, electricity, credit cards and banks?
45
Heraclitusstudent
2019 Mar 29, 3:36pm
Buy and hold is great: the Dow was at 10,000 in 99 then again in 2004, then again in 2008, then in 2011, with a couple of trips to 8000 in between.
But we moved on... Dow 25,000 is the new baseline.... It will do x2.5 again soon.
But we moved on... Dow 25,000 is the new baseline.... It will do x2.5 again soon.
46
clambo
2019 Mar 29, 4:05pm
Everyone focuses on the value of the indices while not counting the compounding dividend effect which over time is tremendous.
I remember when the Dow was 4000 and they said it was far too high and ready to crash.
I follow the W5000 index anyway.
When I look at my stock mutual funds over decades, I see a significant % of the increase was actually dividends. I'm not going to give that up.
I remember when the Dow was 4000 and they said it was far too high and ready to crash.
I follow the W5000 index anyway.
When I look at my stock mutual funds over decades, I see a significant % of the increase was actually dividends. I'm not going to give that up.
47
Heraclitusstudent
2019 Mar 29, 4:28pm
Ok I'll keep 8-10% in dividend stocks with DRIPs since Rin recommends it.
NAC gives me almost 5% tax free btw - though this return may go down with leverage now.
NAC gives me almost 5% tax free btw - though this return may go down with leverage now.
48
 rocketjoe79
2019 Mar 29, 9:02pm
rocketjoe79
2019 Mar 29, 9:02pm
And: Has the the Brexit Issue already been priced in, or will Brexit follies start a European downturn, followed by our own recession? This is an ugly uncertainty.
49
cmdrda2leak
2019 Mar 29, 9:12pm
clambo says
What are your favorite dividend holds? What do you think about non-dividend-pooping dividend ETFs like NOBL?
Everyone focuses on the value of the indices while not counting the compounding dividend effect which over time is tremendous.
I remember when the Dow was 4000 and they said it was far too high and ready to crash.
I follow the W5000 index anyway.
When I look at my stock mutual funds over decades, I see a significant % of the increase was actually dividends. I'm not going to give that up.
What are your favorite dividend holds? What do you think about non-dividend-pooping dividend ETFs like NOBL?
50
cmdrda2leak
2019 Mar 29, 9:24pm
rocketjoe79 says
I think Brexit is a non-issue, outside of a 1 year window. Either:
A. No-deal Brexit. 1.5 months of slight panic. UK declares willingness to trade with EU states on WTO terms, continues open and vigorous trade with US and especially Commonwealth countries. City of London retains global finance hub status. EU later begs for better deal. Boris Johnson strings them along and eventually offers UK-beneficial deal.
B. Foot dragging. UK begs for 3 more months. EU offers shit deal. UK takes it out of low self-esteem. Trade union effectively remains, but with UK as sad economic vassal state of EU. City of London retains global financial hub status.
C. Total capitulation. Reversal of democratically selected outcome. Re-vote on referendum called. Everyone suspects tampering. Vote occurs and 'remain' wins by a nose. Bitter internal acrimony. Crime spikes (even more). Sanctity of UK democracy cast into doubt. City of London retains global financial hub status. Financial life continues unaffected for non-UK citizens.
And: Has the the Brexit Issue already been priced in, or will Brexit follies start a European downturn, followed by our own recession? This is an ugly uncertainty.
I think Brexit is a non-issue, outside of a 1 year window. Either:
A. No-deal Brexit. 1.5 months of slight panic. UK declares willingness to trade with EU states on WTO terms, continues open and vigorous trade with US and especially Commonwealth countries. City of London retains global finance hub status. EU later begs for better deal. Boris Johnson strings them along and eventually offers UK-beneficial deal.
B. Foot dragging. UK begs for 3 more months. EU offers shit deal. UK takes it out of low self-esteem. Trade union effectively remains, but with UK as sad economic vassal state of EU. City of London retains global financial hub status.
C. Total capitulation. Reversal of democratically selected outcome. Re-vote on referendum called. Everyone suspects tampering. Vote occurs and 'remain' wins by a nose. Bitter internal acrimony. Crime spikes (even more). Sanctity of UK democracy cast into doubt. City of London retains global financial hub status. Financial life continues unaffected for non-UK citizens.
51
 B.A.C.A.H.
2019 Mar 29, 9:38pm
B.A.C.A.H.
2019 Mar 29, 9:38pm
About Brexit they were not on the Euro. If a large country like Italy or Spain quits the Euro, that may be something else!
52
 MisdemeanorRebel
2019 Mar 29, 11:04pm
MisdemeanorRebel
2019 Mar 29, 11:04pm
cmdrdataleak says
This is why I'm hoping Modi, Trump, Abe, Moon, Morrison, (forget Trudeau the Wimp) etc. sent a high powered delegation on a speaking tour, perhaps starting at Manchester's Free Trade Hall, talking about all the fantastic, better deals UK Customers will get, and how they'll have to probably setup UK service centers and final assembly locations.
Big names if not launched by the leaders themselves, and really get the Remoaners to actually explain how staying in the EU is less limiting that outside it, which they cannot do. It's incredibly ironic that Remoaners have staked out remaining as "Open" but Brexit as "Provincial" when it is actually the opposite.
Another great way to convince the Left is the Amazon/Google Dublin Tax Dodge will be likely be shut down if the UK makes a clean Brexit. And why Varadkar is scared shitless.
A. No-deal Brexit. 1.5 months of slight panic. UK declares willingness to trade with EU states on WTO terms, continues open and vigorous trade with US and especially Commonwealth countries. City of London retains global finance hub status. EU later begs for better deal. Boris Johnson strings them along and eventually offers UK-beneficial deal.
This is why I'm hoping Modi, Trump, Abe, Moon, Morrison, (forget Trudeau the Wimp) etc. sent a high powered delegation on a speaking tour, perhaps starting at Manchester's Free Trade Hall, talking about all the fantastic, better deals UK Customers will get, and how they'll have to probably setup UK service centers and final assembly locations.
Big names if not launched by the leaders themselves, and really get the Remoaners to actually explain how staying in the EU is less limiting that outside it, which they cannot do. It's incredibly ironic that Remoaners have staked out remaining as "Open" but Brexit as "Provincial" when it is actually the opposite.
Another great way to convince the Left is the Amazon/Google Dublin Tax Dodge will be likely be shut down if the UK makes a clean Brexit. And why Varadkar is scared shitless.
53
clambo
2019 Mar 29, 11:42pm
For cmdrdataleak's question, I generally have owned stock mutual funds which have had capital appreciation as the objective. My W5000 index fund may or may not be considered a capital appreciation fund. Although my funds were not focused on dividends, a significant % of the overall return over several decades seem to be dividends anyway.
I have some inherited funds which have a focus on dividends, dividend growth, and income including dividends; Vanguard Equity Income, Vanguard Dividend Growth, Vanguard Wellington, Vanguard Wellesley Income.
Although it may be higher risk, prefer the tax efficiency of my funds that were not focused on income; now I have some tax consequences which I wish I had avoided. I should have sold many of the income producing funds when I inherited them and bought more capital appreciation funds or more of the W5000 index fund.
54
AD
2019 Mar 30, 9:16am
clambo says
The dividend for the Vanguard Total Stock Market Index Fund (aka: Wilshire 5000) has averaged about 2%. The total average annual return since 1992 has been 9.62%.
https://personal.vanguard.com/us/JSP/Funds/Profile/VGIFundProfile0085Content.jsf?tab=0&FundId=0085&FundIntExt=INT
This is alarming as I would think this fund should have a total average annual return of at least 11% since 1992 when you consider the amount of appreciation in the 1990s.
My W5000 index fund may or may not be considered a capital appreciation fund. Although my funds were not focused on dividends, a significant % of the overall return over several decades seem to be dividends anyway.
The dividend for the Vanguard Total Stock Market Index Fund (aka: Wilshire 5000) has averaged about 2%. The total average annual return since 1992 has been 9.62%.
https://personal.vanguard.com/us/JSP/Funds/Profile/VGIFundProfile0085Content.jsf?tab=0&FundId=0085&FundIntExt=INT
This is alarming as I would think this fund should have a total average annual return of at least 11% since 1992 when you consider the amount of appreciation in the 1990s.
55
clambo
2019 Mar 30, 9:57am
AD, my other funds have often performed better than the W5000 fund. On the other hand, it's not going to surprise me on the downside as some other popular funds have flamed out.
My best performing funds have been managed by Primecap in Pasadena (the funds were sold by Vanguard) and some funds at T. Rowe Price
One nice thing about the W5000 index fund was I didn't get a large 1099 from the fund which is also good for long term returns.
If the W5000 fund since 1992 had an average return of 9.62% then that implies that the market itself rose about this amount (minus fees and trading costs in the fund).
Today my expenses for the fund are a super low 0.05% because I have "admiral shares".
Fidelity sells a W5000 fund with 0% expense ratio and no minimum investment.
56
AD
2019 Mar 30, 10:28am
clambo says
Thanks, I'll check out PrimeCap which is located in Pasadena, CA.
From everything I've read, the broad market should average 11% to 12% historically. It looks like the 2000's were hard on the Wilshire 5000 index funds and that is why the Vanguard fund for the Wilshire 5000 is only 9.6% annually since 1992 (and with a 0.12% expense ratio).
Primecap in Pasadena
Thanks, I'll check out PrimeCap which is located in Pasadena, CA.
From everything I've read, the broad market should average 11% to 12% historically. It looks like the 2000's were hard on the Wilshire 5000 index funds and that is why the Vanguard fund for the Wilshire 5000 is only 9.6% annually since 1992 (and with a 0.12% expense ratio).
57
clambo
2019 Mar 30, 5:01pm
More boring grist for the mill about my mutual fund experience for several decades.
I have several kinds of funds, some are managed, some are index funds; some have done very well and some have been average.
But, when I am curious about my net worth on some day after the market closes, if I just look at the W5000 index increase % and multiply it by my stock funds total net, the result is almost identical to adding up the balances that night.
58
AD
2019 Mar 30, 5:22pm
clambo says
Congratulations you have at best matched the Wilshire 5000's performance.
But, when I am curious about my net worth on some day after the market closes, if I just look at the W5000 index increase % and multiply it by my stock funds total net, the result is almost identical to adding up the balances that night.
Congratulations you have at best matched the Wilshire 5000's performance.
59
clambo
2019 Mar 30, 9:51pm
Over time my total return is slightly higher but I can estimate my net worth increase without too much difficulty.
I haven't done anything, the managers of the mutual funds have done it.
There are a lot of people once working at Merrill Lynch, Bear Stearns, Lehman Brothers and other places who sure wish they had settled for the W5000.
Most investors do worse than the indices and mutual funds because they sell mutual funds to buy the ones which have already gone up and become famous. This actually makes you lag fund performance over time.
60
AD
2019 Mar 30, 9:58pm
clambo says
Yes, its called chasing gains.
Go long. Realize the significance of risk premium and efficient market theory.
buy the ones which have already gone up and become famous.
Yes, its called chasing gains.
Go long. Realize the significance of risk premium and efficient market theory.
61
 just_passing_through
2019 Mar 31, 10:28am
just_passing_through
2019 Mar 31, 10:28am
clambo says
I have to log into about 10 websites, copy and paste numbers into my excel spreadsheet. Takes me about 30mins! I only do it about 2-3x per year though. Mint.com and things like that give me the creeps.
"my.yahoo" used to compute and show the market value changes of stocks, etc., pretty well but they messed that up a decade or so ago.
when I am curious about my net worth on some day after the market closes, if I just look at the W5000 index increase % and multiply it by my stock funds total net, the result is almost identical to adding up the balances that night.
I have to log into about 10 websites, copy and paste numbers into my excel spreadsheet. Takes me about 30mins! I only do it about 2-3x per year though. Mint.com and things like that give me the creeps.
"my.yahoo" used to compute and show the market value changes of stocks, etc., pretty well but they messed that up a decade or so ago.
62
clambo
2019 Mar 31, 11:04am
I saw that if I want to add outside investments to my Vanguard page I can see them all together if I want to. I didn't do that however.
Most of my funds are with 2 companies, Vanguard and T. Rowe Price. The other two are small amounts of a couple things which I inherited.
In the 80's and early 90's the people I talked to were older than I; now when I call up they sound very much younger than who worked at these places before. I believe the business has grown huge in the last 30-40 years.
Off the subject even more; I can remember a trade at Merrill, Dean Witter, etc. cost $250; today I get 25 free trades per year and after that they are just $2, even if I want to speak to a human to make the trade over the phone.


65
 Goran_K
2019 Apr 9, 2:13pm
Goran_K
2019 Apr 9, 2:13pm
Didn't Iwog do this and basically throw 125% of his potential net worth into a fire?
66
clambo
2019 Apr 9, 2:43pm
On principle I will never, ever, lend my money to a bank in return for lousy low interest and "safety".
67
Heraclitusstudent
2019 Apr 9, 2:58pm
Goran_K says
Watch me do the same!
Didn't Iwog do this and basically throw 125% of his potential net worth into a fire?
Watch me do the same!
68
Misc
2019 Apr 9, 4:47pm
Yes, that's what America needs is more mutual funds especially index funds. There are now more index funds than there are stocks traded on the NYSE. You'd figure that people would figure out that there is a scam going on when Fidelity came out with index funds that charge no management fees. I figured that "zero bound" would last about a month and I was right. Now there is an EFT that has a negative expense ratio. Definitely the time to invest in stocks is here.
69
just_passing_through
2019 Apr 9, 9:31pm
zzyzzx says
Do they have penalties? I just move money to Ally bank which has 2.3% 11month no withdrawal penalty.
Capital One is 2.7%, Discover is 2.65%
Do they have penalties? I just move money to Ally bank which has 2.3% 11month no withdrawal penalty.
70
CBOEtrader
2019 Apr 10, 3:30am
Heraclitusstudent says
I'm not questioning the logic, just the timing.
I'd wait to see cracks in the dam, hopefully selling 12% or so from the top.
Goran_K saysDidn't Iwog do this and basically throw 125% of his potential net worth into a fire?
Watch me do the same!
I'm not questioning the logic, just the timing.
I'd wait to see cracks in the dam, hopefully selling 12% or so from the top.
71
 BayArea
2019 Apr 10, 6:05am
BayArea
2019 Apr 10, 6:05am
The likelihood that you’ll time exit and rentry correctly isn’t in your favor.
72
Heraclitusstudent
2019 Apr 10, 10:01am
CBOEtrader says
By the time you see the cracks clearly, the market will already have dived.
The timing is a crap shoot.
But a decision needs to be made.
"There is a tide in the affairs of men.
Which, taken at the flood, leads on to fortune;
Omitted, all the voyage of their life
Is bound in shallows and in miseries."
For the record: Brutus got beaten and committed suicide after making that decision.
I'm not questioning the logic, just the timing.
I'd wait to see cracks in the dam, hopefully selling 12% or so from the top.
By the time you see the cracks clearly, the market will already have dived.
The timing is a crap shoot.
But a decision needs to be made.
"There is a tide in the affairs of men.
Which, taken at the flood, leads on to fortune;
Omitted, all the voyage of their life
Is bound in shallows and in miseries."
For the record: Brutus got beaten and committed suicide after making that decision.
73
Goran_K
2019 Apr 10, 10:14am
Heraclitusstudent says
Why? Are you making a big purchase or do you actually think the market is going to crash like Iwog did?
Watch me do the same!
Why? Are you making a big purchase or do you actually think the market is going to crash like Iwog did?
« First « Previous Comments 34 - 73 of 73 Search these comments
I think the best we can hope at this point is 1 year of slow growth and a volatile market before some kind of recession.