patrick.net
An Antidote to Corporate Media
1,202,279 comments by 14,262 users - Ceffer, RC2006, REpro online now

Call me crazy.. but I'm calling a bottom!
2012 Feb 24, 8:23pm 54,526 views 167 comments
« First « Previous Comments 165 - 167 of 167 Search these comments
my heartfelt application to Patrick
I've never heard it put quite that way before...?
I should spell check better... Guess that what happens when you're up at 12:00 am. after a ten hour day.
the days of large year over year price drops are over.
You speak as if we had years and years of large price drops...
We had almost a two year period where, every month, the Y-o-Y decline was significant. Many said that prices "always went up" until they suddenly didn't. Once the trend of rising prices started to reverse itself, others said "prices are going to continue to drop" and were saying it at the time of my OP. So far it seems as if my analysis has been mostly correct.
Also, I put my money where my mouth was, buying in 2012. Yes I'm breaking my own arm patting myself on the back - but even I'm impressed at how right I was. Normally when I make predictions on blogs like this I end up with egg on my face
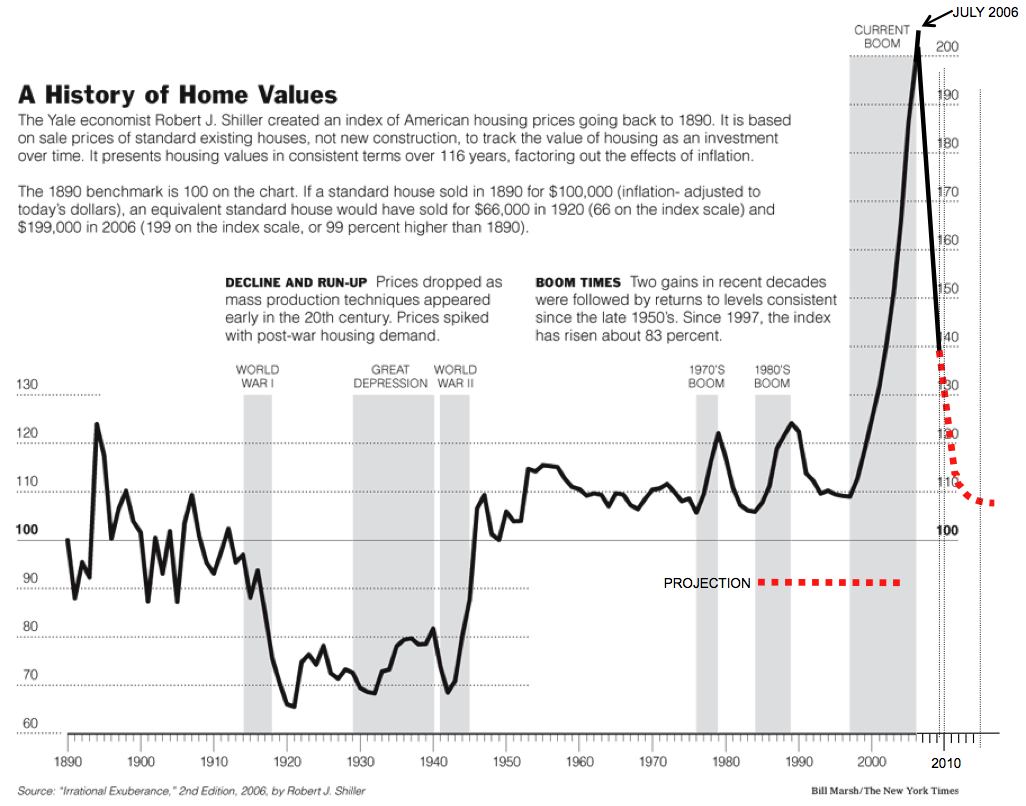
Here's my take on it. If you look at the long term C-S index it tells quite an interesting story. Prior to the 1900's, prices were more erratic. Boom and bust cycles were seen as natural events back then, and the government did not intervene much, if at all. You can see the wild price swings, but they all centered around a mean of about 100.
Fast forward to the deceased after WWII. Price swings were more modest, and the mean shifted up to about 110. I think this is due to the rise of the two income household. More money = more house.
Now lets look at recent history. Level is now in or around 130. I think this is directly attributable to the governments attempt to put a floor on this - from low interest rates to large hedge funds buying up properties, The powers that be wanted to stop the bleeding and like it or not, it seems that they have succeeded.
Going forward I think we'll see a few smaller boom / bust cycles over the next decade with the index fluctuating around the "new normal" mean index value of about 130.
(Images below) Large chart is taken from Barry Ritzholt's blog. The link to the smaller chart of more recent data is from the New York Times website.
« First « Previous Comments 165 - 167 of 167 Search these comments
http://money.cnn.com/2012/02/22/real_estate/home_sales/index.htm
Now in some areas prices might still have 5% to 10% to go, but on the average, we're probably more or less at the bottom. Prices may move slightly (+/- 1.5%) up or down month to month from here on out, but from my take on the available data, the days of large year over year price drops are over.
Just my two cents.