patrick.net
An Antidote to Corporate Media
1,199,996 comments by 14,186 users - HeadSet, Kepi, Patrick online now
Bad News For America's Biggest Housing Bubble: San Francisco Home Prices Suffer
2015 Mar 31, 11:12am 29,273 views 58 comments
« First « Previous Comments 19 - 58 of 58 Search these comments
You may well be right about Utah and Colorado. No reason to expect growth and population increase in California won't continue as it always has.
California will always sit on the Throne. :)
Not according to the article, this is Kotkin's thing
Dear Patnet friends,
We are on the cusp of another major and sustained rise in home prices. If you missed the first boat this is your opportunity not to miss the next boat. It's about to leave.
Thanks
Strategist
You may well be right about Utah and Colorado. No reason to expect growth and population increase in California won't continue as it always has.
California will always sit on the Throne. :)Not according to the article, this is Kotkin's thing
It's possible these states will have a higher growth rate than California. But they come from a very small economic base compared to California the 8th largest economy the world.
I have been hearing doomsday predictions for California since day one, yet the sun continues to shine.
I have been hearing doomsday predictions for California since day one, yet the sun continues to shine.
Yup, the bottom line is jobs. The bottom line on that is cites are a more efficient way to live and the exchange of ideas promulgate in areas that foster innovation. So the question is can that occur elsewhere? I think Austin is indicative that it can? Not to mention how technology has made communication easier.
You can be in the middle of the Pacific and get your work done with a computer and internet.
Austin is now a major technological center with low home prices and good jobs. If I was working in tech and couldn't afford SV homes, I would just move to Austin.
Rates have dropped from 17% in 1981 to 3%. Wages have also increased 3 fold since then. So home prices based on that should be atleast 20 fold 1981 prices.
See any general trend line in these two graphs?
Rates are down and home prices are up. We still need to factor in wages and come up with an affordability index to really get the right picture. You can come up with a whole set of affordability indexes. As long as you plot the same index over time you will be fine. I would just stick with the one economists use the most.
If you use the "real income" data for wages, you will need to use the "real" home prices too.
Just cut to the chase and use the regular affordability index.
If you use the "real income" data for wages, you will need to use the "real" home prices too.
Just cut to the chase and use the regular affordability index.Feel free to step up and provide them.... After all your the finance and economist guy here!
I have many times. But OK, when I get back.
Chinese cash buyers
Everywhere? Remember, the 13% rise I quoted is the national number - the same index you used when you said: "the 0.7% drop in rates resulted in 4.6% rise in prices". Clearly, Chinese cash buyer are not pushing up the national number. So again, nationally we can say that:
the 0.7% drop in rates resulted in 4.6% rise in prices (2014-2015)
the 1.0% RISE in rates resulted in a 13% rise in prices (2013-2014)
How is this possible?
You tell me, since you're trying to bait the question.
OK. After researching the issue, I have come to the conclusion that a rise in interest rates does not necessarily mean that we shall see a nominal drop in prices. Intuitively, this is a strange notion I admit - but it works when you understand that nominal wages continue to rise (even if real do not). More importantly, it reconciles the data from the early 1980s where we saw a massive rise in interest rates, with absolutely no drop in nominal prices whatsoever.
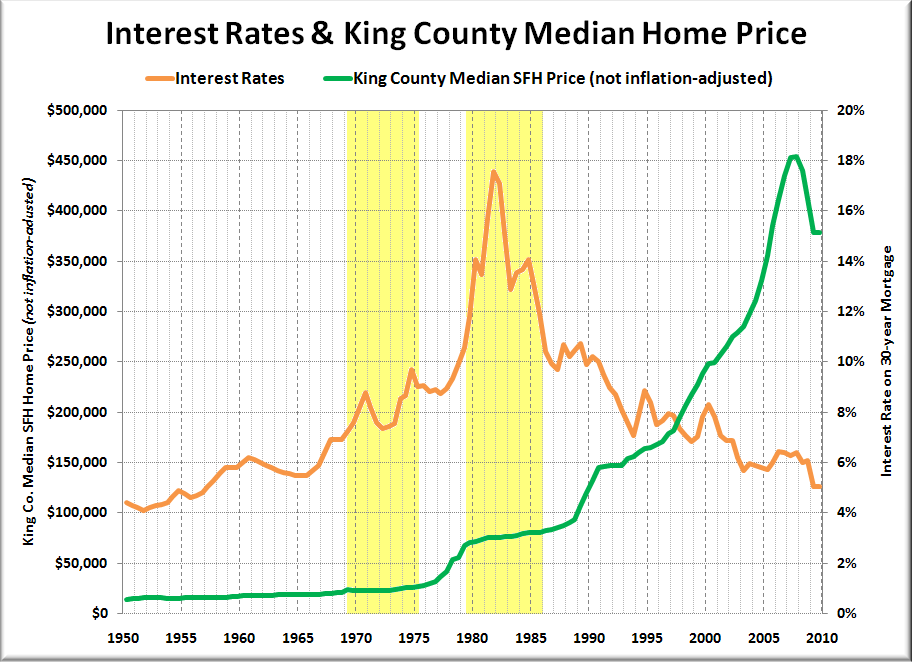
In your chart, what happened to prices in the late 80's and following decades when rates headed down?
Lets put this into the "asked and answered" column. No question about it, when the rates fell, prices rose. The question though is, did the first thing lead to the other - and that is what I want to now redirect the focus back toward (i.e. the claim that a rise in rates causes a nominal drop in prices).
In that regard, while I do not appreciate the claim of "cherry picking", I can attest to the fact that nationwide prices did the same thing that Seattle prices - which is to say they eked out very small nominal gains despite the massive spike in interest rates. The national data is below, but if you are not inclined to click on the link, here are end of year values:
Dec 1980.....46.41
Dec 1981.....48.79 (5% increase)
Dec 1982.....49.08 (0.6% increase)
Dec 1983.....51.39 (4.7% increase - 10.7% increase 1980-1983)
http://us.spindices.com/indices/real-estate/sp-case-shiller-us-national-home-price-index
In any event, the data clearly throws a wrench in the "a rise in rates causes a (nominal) drop in prices" claim. After all we now have
a 0.7% drop in rates during a 4.6% rise in prices (2014-2015)
a 1.0% RISE in rates during a 13% rise in prices (2013-2014)
an approx. 8% rise in rates during a 10% rise in prices (1980-1983).
Clearly, if we are to display any intellectual honesty here, this discrepancy must be explained.
Do you have a Word doc open with phrases that you just copy and paste?
Bigs - you too please. No insults for the time being.
I want to see if CIC can come to the inescapable conclusion I want to see if the word combination "yes the data does not show that rising rates = falling nominal prices" can tick off his keyboard. Any other thread you guys can troll all you want, but I want to see what happens here.
CIC again - sorry for the distractions. The data shows us
a 0.7% drop in rates during a 4.6% rise in prices (2014-2015)
a 1.0% RISE in rates during a 13% rise in prices (2013-2014)
an approx. 8% rise in rates during a 10% rise in prices (1980-1983).
Given this discrepancy, how can you continue to maintain that a rise in rates will = a nominal drop in prices?
The best explaination to your 2013-2014 price rises is that during the time frame, even including 2012, there was a large cash and institutional purchase wave going on, not worried about prices but chasing yields. Somewhere in the range of 40% - 50% of buyers. That's not a normal organic housing market. Plus, it was a wave coming off of the bottom of the housing crash, so once again, that's not a "normal" market.
Thanks for a cogent answer. That said, between your answer here and response to the 80s we now have at least two separate and distinct instances where rising rates DOES NOT mean a nominal drop in prices. Yes, we have plenty of instances with falling rates and rising prices, but again there is thusfar no compelling data to indicate rising rates = falling nominal prices. Do you agree with this?
OK. After researching the issue, I have come to the conclusion that a rise in interest rates does not necessarily mean that we shall see a nominal drop in prices. Intuitively, this is a strange notion I admit - but it works when you understand that nominal wages continue to rise (even if real do not). More importantly, it reconciles the data from the early 1980s where we saw a massive rise in interest rates, with absolutely no drop in nominal prices whatsoever.
This is something you don't see every day.
What? someone changing their mind.
So in a 35 year time period, you have a few exceptions to a general trend. Like that is such an abnormal occurrence?
According to your reasoning in any climate-change thread, any deviation from a trend disproves that trend.
See any general trend line in these three graphs?
*

I see a rate reduction continuing that is correlated with outsourcing and bubble creation.
Is it true or not true that for every change of 1% in rate, the buying power changes 10% for the same payment amount?
Is it true or not true that the majority (I didn't say ALL) of people buy houses based on monthly payment amount? Is it true or not true in a normal organic housing market that 2/3 of buyers, buy with a mortgage?
These are both very common sense arguments that I fully understand, but as we have seen the data does not bear out.
I post this again for the rate vs price trend 1950-2009. I can attest that national prices follow the same path, and both data sets show rising prices on a YOY basis (1950-2006), but if you believe I am cherry picking I will post them in a separate link. What I can tell you is this - from 1950 until 1983 there is not a single year period in which national nominal prices declined. None. Thus the only way I can reconcile the common sense view with the data is to note that due to the "stickiness" of prices, and the general trend of wage growth (real or nominal) being a lagging yet necessary component of inflation is to conclude that rising rates do not have much influence on nominal prices. As such, you would assume that those who shop for payments (which I agree with you are a lot of folks) are squeezed out such that the volume of transactions declines at least for short periods of times until wages "catch up" in the nominal or real sense. Note, the data that bears this part out (volume) is spotty at best, but it does help explain a 33 year period that is otherwise unexplainable. In any event, the people who are frozen out at 500K are eventually able to buy a few years later at 515K which given the nominal wage growth, is now suddenly more "affordable"
see a rate reduction continuing that is correlated with outsourcing and bubble creation.
I see rate reductions correlated with wealth inequality.
BTW - to further bolster my point, look what happens when you look at that same graph in not nominal but real (inflation adjusted) terms:
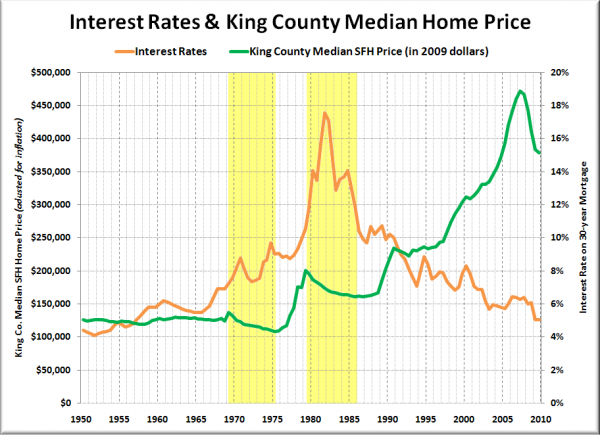
Here we see that the imbalances are resolved not in out and out nominal price declines, but the lagging yet necessary wage growth making things more affordable. Thus the data says that the house that is 500K now should be more affordable in 5 years when it is only 515K.
The problem of course is very few people are happy to pass on a 500k house, rent 5 more years and then buy it at "only" 515K when it is more affordable - yet that is exactly what the real and nominal data both say will happen.
In any event, I offer all this up as a competing narrative to the "rate growth = nominal price declines" which is a common sense narrative but flies in the face of the most comprehensive data I can find on the subject matter. I note this because for years people would cite the rising rates = falling prices meme, and you could tell that they literally thought that if they wait, the 500K house will be 480K, 460K etc. in the future. That is not what the data says. The data says that as rates rise, the 500K house will perhaps underperform, but still rise nonetheless.
Put another way, if someone thinks that due to rising rates, a 500K house will be more "affordable" if they wait a few years when it is only 515K the data says they will be right. However, if they think that due to rising rates the 500K house will become more affordable due to out and out nominal price declines, just know that the data suggests they will be bitterly bitterly disappointed.
If you use the "real income" data for wages, you will need to use the "real" home prices too.
Just cut to the chase and use the regular affordability index.Feel free to step up and provide them.... After all your the finance and economist guy here!
I have many times. But OK, when I get back.
Homes are VERY VERY affordable right now.
The affordability index used by economists. Graph goes back to 1981.
http://research.stlouisfed.org/fred2/graph/?id=COMPHAI,FIXHAI,
Incomes, interest rates, and home prices. Medians
Doesn't seem to show much change in the income line of the graph?
Doesn't seem to show much change in the income line of the graph?
Not sure what you mean. Use the second graph. It's just a formula plotted over time.
http://research.stlouisfed.org/fred2/graph/?id=COMPHAI,FIXHAI,
Can you tell us where these houses might be? Certainly isn't CA..
*

It's based on the whole country. The median prices are around $200K.
California, NY, Hawaii will be nowhere close.
The point is homes not being affordable is a myth. The number one factor affecting home affordability are the interest rates, which have been on a long term down trend since 1982.
The Orange County affordability was below 10 prior to the crash, and now it is at 21.
Mark my words......Home prices and home sales are about to jump. Inventory in key areas are too low, and loans are getting easier to get.
I stand by my past expectations of OC median rising to $800K by the end of 2017. Even home builder stocks prices will explode.
Not sure what you mean. Use the second graph. It's just a formula plotted over time.
In 2008 to 2013 ? it does not show any decline. While houses prices increased, there was record unemployment.
California, NY, Hawaii will be nowhere close.
Neither is NJ...
Yes. Boston, Washington DC too.
The Orange County affordability was below 10 prior to the crash, and now it is at 21.
Mark my words......Home prices and home sales are about to jump. Inventory in key areas are too low, and loans are getting easier to get.
I stand by my past expectations of OC median rising to $800K by the end of 2017. Even home builder stocks prices will explode.
You will regret that statement.
Have you read anything Logan has said? The house are not affordable because of price not because of interest rates. He indicates how the 1st time buyers have disappeared from RE, because of the price. Of course he is from a place that may not apply to you...
Or is this another april fools joke?
Not sure what you mean. Use the second graph. It's just a formula plotted over time.
In 2008 to 2013 ? it does not show any decline. While houses prices increased, there was record unemployment.
From 2008 housing prices collapsed, and did not really start recovering until 2012.
Interest rates also declined during this period, further making homes more affordable.
Higher unemployment would have a negative impact on this graph, but would be more than offset by falling home prices and interest rates.
Higher unemployment would have a negative impact on this graph, but would be more than offset by falling home prices and interest rates.
Demand for houses is created by jobs, that graph is non sequitur.
The Orange County affordability was below 10 prior to the crash, and now it is at 21.
Mark my words......Home prices and home sales are about to jump. Inventory in key areas are too low, and loans are getting easier to get.
I stand by my past expectations of OC median rising to $800K by the end of 2017. Even home builder stocks prices will explode.You will regret that statement.
Have you read anything Logan has said? The house are not affordable because of price not because of interest rates. He indicates how the 1st time buyers have disappeared from RE, because of the price. Of course he is from a place that may not apply to you...
Or is this another april fools joke?
He he he.
If I'm right, I will send everyone a "Yard house" gift certificate for a drink. I will be able to afford it then. :)
Have you read anything Logan has said? The house are not affordable because of price not because of interest rates. He indicates how the 1st time buyers have disappeared from RE, because of the price. Of course he is from a place that may not apply to you...
Logan is a nice guy. Always cool, calm and collective, but he can still be wrong. People buy based on monthly payments, not price. The first time buyers particularly compare their payments to rent. The first time buyers just don't get loans easily. Why would my daughter, a first time buyer not get a loan with an 800 FICO, good job and income, and 20% down. It's disgraceful. I used my assets to get her a loan for a $450K condo.
I cannot stress enough - it's not the affordability, it's the availability of loans. They are finally starting to loosen up. Thank God.
Higher unemployment would have a negative impact on this graph, but would be more than offset by falling home prices and interest rates.
Demand for houses is created by jobs, that graph is non sequitur.
Employment is a big factor that drives demand for homes. More people buy homes when they have jobs and feel secure at their jobs. Unemployment was a lot higher in Spring 2012 when the housing market took off.
You need to remember there are dozens of variables, major and minor that drive the demand for housing. If you latch on to just one or two, you will end up being on the wrong side all too often.
nice guy. Always cool, calm and collective,
That is the only kind they allow into Irvine.
it's not the affordability, it's the availability of loans.
That is not what Logan says, i.e. they don't qualify because the cost is more than they qualify for. The loans have been available for a while.
Homes are VERY VERY affordable right now.
Very?
What's the chance the graph makes a turn back down like it did last year this time?
*

he he he. Short time frame. It's called "lying with statistics"
It's been very affordable since 2009. :)
Why would my daughter, a first time buyer not get a loan with an 800 FICO, good job and income, and 20% down. It's disgraceful. I used my assets to get her a loan for a $450K condo.
Maybe because she needs at least a $100K job to afford the payments on $450K?
No. It was technicalities. They can't use bonus income to qualify for a loan unless it's been there for atleast 2 years. She has been working for 18 months after she graduated.
She will qualify in 6 months.
it's not the affordability, it's the availability of loans.
That is not what Logan says, i.e. they don't qualify because the cost is more than they qualify for. The loans have been available for a while.
I could not understand why he said that.
http://krcc.org/post/despite-recovery-many-find-home-loans-still-hard-get
It's been seven years since the housing crash. The housing market and the economy are both recovering. But housing advocates say you still have to have a near perfect credit score to get a loan from a major bank.
At first look, it seems like the trouble in the housing market has quieted down. There are fewer foreclosures. Home prices have stabilized and risen. But, as any parent with young kids will tell you, when things get too quiet that can be a bad sign.
Mike Calhoun, the president of the Center for Responsible Lending, says that's basically what's going on here.
"This has been a quiet disaster," he says. "Average families are unable to get home loans. That includes everyone from new households. It includes people who lost their job through the recession and [are] trying to get back into homeownership now that they're back on their feet and should qualify for mortgages."
And Calhoun says there are a lot of people like that who can't qualify for home loans because of overly tight lending standards.
Also he said that the fact that the price of the houses have gone up so much is why they are not qualifying.
« First « Previous Comments 19 - 58 of 58 Search these comments
http://www.zerohedge.com/news/2015-03-31/bad-news-americas-biggest-housing-bubble-san-francisco-home-prices-suffer-biggest-dr
#housing