patrick.net
An Antidote to Corporate Media
1,192,891 comments by 13,872 users - askmeaboutthesaltporkcure, RWSGFY online now

I'm liquidating my stocks and going to cash
2019 Mar 28, 10:56am 4,987 views 73 comments
« First « Previous Comments 10 - 49 of 73 Next » Last » Search these comments
10
EBGuy
2019 Mar 28, 11:41am
Speaking of Ducky, if I remember correctly, he made small fortune last time around by literally hauling around a wheel barrow full of silver. The gold/silver ratio is above 85 and has been consistently above 80 the last half a year. One of them has gotta give soon (either gold collapses or silver rises). I've been contemplating moving some retirement cash into SLV as a hedge.
11
 CBOEtrader
2019 Mar 28, 11:48am
CBOEtrader
2019 Mar 28, 11:48am
Quigley says
Liquidating into the volatile election not the worst idea, but he should have bought back in a month later. In fact, I'd bet IWOG bought back in at some point. Hes smart enough to identify a trend.
To the OP point, the recent extra volatility is a signal for increased chances of a market downturn.
This is exactly what my research suggests as well. Watch the vix. The relevant resistance points are 18, 22, 28, and 35. Above each, we go into a new distinctly more challenging market environment...and YES the vix itself is both a signal for increased bearish pressure and OVERPERFORMANCE of implied vol. (Or underperformance at low IV's.)
Ex: Sell options when vix is below 22. Do nothing from vix 22 to 28, and buy puts when vix is > 28.
^^ this by itself is a winning trading strategy.
Heraclitusstudent saysIwog was early and I might be too.
Of course you’re correct that such things are cyclical. And that timing is everything.
I missed the real estate bottom by a couple years because I was thinking pure economics. That particular person actually set me straight just in time to make some money in the market.
Liquidating into the volatile election not the worst idea, but he should have bought back in a month later. In fact, I'd bet IWOG bought back in at some point. Hes smart enough to identify a trend.
To the OP point, the recent extra volatility is a signal for increased chances of a market downturn.
This is exactly what my research suggests as well. Watch the vix. The relevant resistance points are 18, 22, 28, and 35. Above each, we go into a new distinctly more challenging market environment...and YES the vix itself is both a signal for increased bearish pressure and OVERPERFORMANCE of implied vol. (Or underperformance at low IV's.)
Ex: Sell options when vix is below 22. Do nothing from vix 22 to 28, and buy puts when vix is > 28.
^^ this by itself is a winning trading strategy.
12
Heraclitusstudent
2019 Mar 28, 12:44pm
CBOEtrader says
Long treasuries and tax free municipal. Waiting for yields to bounce back a bit.
Just straight cash?
Long treasuries and tax free municipal. Waiting for yields to bounce back a bit.
13
 BayArea
2019 Mar 28, 12:51pm
BayArea
2019 Mar 28, 12:51pm
You might be right
Or you might be wrong and miss out on 15% gain this year lol
Or you might be wrong and miss out on 15% gain this year lol
14
CBOEtrader
2019 Mar 28, 2:14pm
Heraclitusstudent says
Careful there homie. Treasuries fall in value as rates rise. Considering the flat to inverted yield curve, just keep it super short
CBOEtrader saysJust straight cash?
Long treasuries and tax free municipal. Waiting for yields to bounce back a bit.
Careful there homie. Treasuries fall in value as rates rise. Considering the flat to inverted yield curve, just keep it super short
15
CBOEtrader
2019 Mar 28, 2:14pm
BayArea says
he's trying to dodge a possible 40% correction, but you are correct
You might be right
Or you might be wrong and miss out on 15% gain this year lol
he's trying to dodge a possible 40% correction, but you are correct
17
Heraclitusstudent
2019 Mar 28, 3:03pm
CBOEtrader says
As long as we have a revenue shortfall financed by debt, we are solidly anchored on the deflationary side of things.
I see the rates risk as minimal for now.
Careful there homie. Treasuries fall in value as rates rise.
As long as we have a revenue shortfall financed by debt, we are solidly anchored on the deflationary side of things.
I see the rates risk as minimal for now.
18
Heraclitusstudent
2019 Mar 28, 3:29pm
10yr treasury rate will probably fall to low 1% in case of recession.
19
EBGuy
2019 Mar 28, 3:36pm
0ba4 says
Not just bondz. CA TAX-FREE MUNI Bond FUNDZ! WITH LEVERAGE! Who can forget NAC? How soon they forget.
In all fairness, I believe he used NAC in the trusts he managed for generating cash.
When the Duck said cash, it meant bonds
Not just bondz. CA TAX-FREE MUNI Bond FUNDZ! WITH LEVERAGE! Who can forget NAC? How soon they forget.
In all fairness, I believe he used NAC in the trusts he managed for generating cash.
20
Heraclitusstudent
2019 Mar 28, 3:48pm
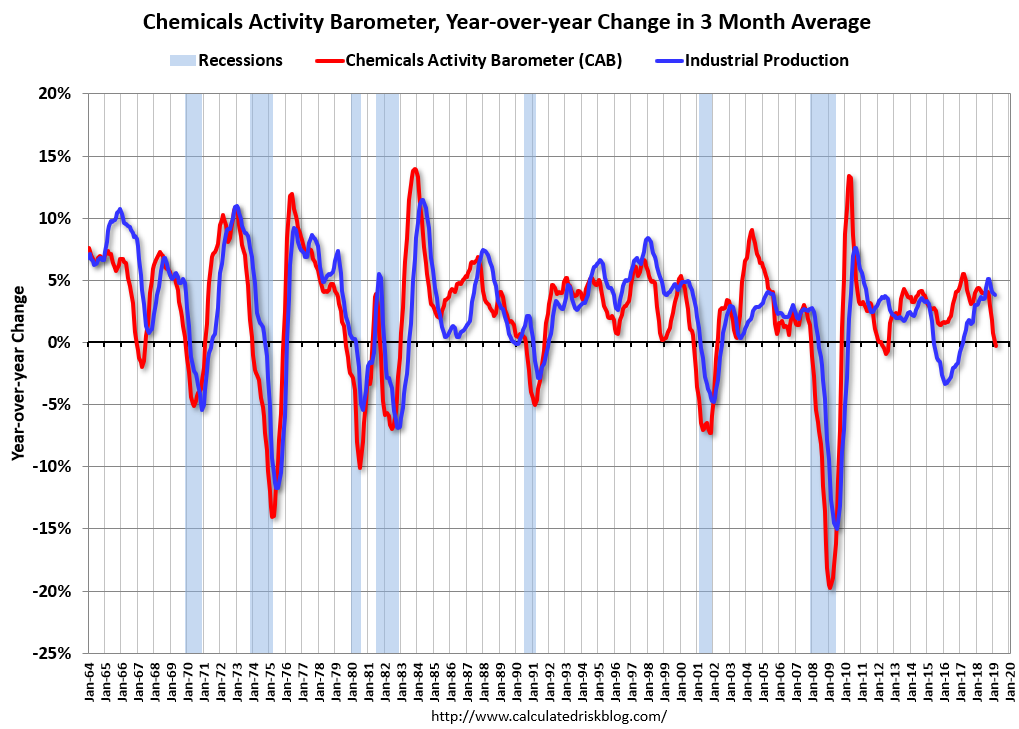
Appendix A: In 7 out of 9 past times this indicator fell to 0, recession ensued.
21
CBOEtrader
2019 Mar 28, 4:06pm
EBGuy says
talk about playing w fire, wow
0ba4 saysWhen the Duck said cash, it meant bonds
Not just bondz. CA TAX-FREE MUNI Bond FUNDZ! WITH LEVERAGE! Who can forget NAC? How soon they forget.
In all fairness, I believe he used NAC in the trusts he managed for generating cash.
talk about playing w fire, wow
22
CBOEtrader
2019 Mar 28, 4:07pm
Heraclitusstudent says
interesting chart
Appendix A: In 7 out of 9 past times this indicator fell to 0, recession ensued.
interesting chart
23
CBOEtrader
2019 Mar 28, 4:11pm
Heraclitusstudent says
I'd worry about not having a recession if you are long the 10 year bonds. Fact is indicators are starting to point down, which can easily reverse. This could very likely (even probably) be a headfake. SO, you are risking missing out the bull market AND eating some losses in your bonds IF the market indicators reverse.
I'm not saying its the wrong move. I am saying your position is not inherently less risky than being long the stock market
10yr treasury rate will probably fall to low 1% in case of recession.
I'd worry about not having a recession if you are long the 10 year bonds. Fact is indicators are starting to point down, which can easily reverse. This could very likely (even probably) be a headfake. SO, you are risking missing out the bull market AND eating some losses in your bonds IF the market indicators reverse.
I'm not saying its the wrong move. I am saying your position is not inherently less risky than being long the stock market
24
mell
2019 Mar 28, 4:25pm
I don't think there will be a recession before 2020 or 2021. The economy is too strong. Sure the fat days of appreciation are over and it will be more volatile which is nice for active traders but I don't see any crash or recession.
25
mell
2019 Mar 28, 4:26pm
But one or two years early is not the worst thing. Or trade biotech mostly event driven and relatively recession proof. But also extremely risky.
26
Heraclitusstudent
2019 Mar 28, 4:31pm
You are right, there is a risk. But remember: no one is paid not to take risks.
Overstaying the rally is a real risk too that becomes larger as the market climbs.
Even if there is a bounce back, it will likely not be for too long until the recession actually comes. So I lose a bit of upside: I say it becomes picking up pennies in front of the steamroller.
There just comes a time when you need to roll your dice.
Iwog did it. Turns out too early.
I do it now. We'll see.
27
mell
2019 Mar 28, 4:35pm
Heraclitusstudent says
I definitely think faang and tech in general has seen their highs.
You are right, there is a risk. But remember: no one is paid not to take risks.
Overstaying the rally is a real risk too that becomes larger as the market climbs.
Even if there is a bounce back, it will likely not be for too long until the recession actually comes. So I lose a bit of upside: I say it becomes picking up pennies in front of the steamroller.
There just comes a time when you need to roll your dice.
Iwog did it. Turns out too early.
I do it now. We'll see.
I definitely think faang and tech in general has seen their highs.
28
mell
2019 Mar 28, 4:38pm
That being said I think we will see DOW 30K. Keep in mind a lot of the economic news are spun negatively due to TDS. If this were a leftoid presidency the media would ring in a new economic golden age.
30
EBGuy
2019 Mar 28, 4:41pm
CBOEtrader says
Man cannot live on treasuries alone. It was yielding 6+% (Tax free) five years ago -- income's gotta come from somewhere. YMMV. NAC is currently yielding 4.8%.
talk about playing w fire, wow
Man cannot live on treasuries alone. It was yielding 6+% (Tax free) five years ago -- income's gotta come from somewhere. YMMV. NAC is currently yielding 4.8%.
31
mell
2019 Mar 28, 4:47pm
APOCALYPSEFUCKisShostikovitch says
What happened to the promised real estate carnage? I'm ready
CASH! is wonderful but by the end, the only currency anyone will care about will be belt-fed ammo and YAM!s.
What happened to the promised real estate carnage? I'm ready
32
Heraclitusstudent
2019 Mar 28, 4:52pm
The understated engine of this cycle has been the recovery of housing, driving a stock market obsessed with tech. Housing prices are now slowing. That fuel is spent.
Trees do not grow to the sky.
Trees do not grow to the sky.
33
mell
2019 Mar 28, 4:54pm
Heraclitusstudent says
I agree but it's mostly housing and a couple of tech trannies that are massively overvalued. The P/E for most stocks is still absolutely reasonable.
The understated engine of this cycle has been the recovery of housing, driving a stock market obsessed with tech. Housing prices are now slowing. That fuel is spent.
Trees do not grow to the sky.
I agree but it's mostly housing and a couple of tech trannies that are massively overvalued. The P/E for most stocks is still absolutely reasonable.
36
EBGuy
2019 Mar 28, 5:21pm
Heraclitusstudent says
I don't disagree, but most of the refund checks haven't been sent out yet. Plenty of non-coastal folks will be getting money back. More sugar to get us through the next election cycle. At this point, though, the tax code is loaded with buried IEDs. Almost unfixable as the Dems (or responsible adults in Congress) will have to argue for tax increases at the same time that they advocate for tax cuts (dispensing with SALT limits) for the coastal elites. This situation is nearly unfixable, so when the house of cards comes down it will blow out spectacularly.
Trump's tax cut is spent too. Sugar high.
I don't disagree, but most of the refund checks haven't been sent out yet. Plenty of non-coastal folks will be getting money back. More sugar to get us through the next election cycle. At this point, though, the tax code is loaded with buried IEDs. Almost unfixable as the Dems (or responsible adults in Congress) will have to argue for tax increases at the same time that they advocate for tax cuts (dispensing with SALT limits) for the coastal elites. This situation is nearly unfixable, so when the house of cards comes down it will blow out spectacularly.
37
Heraclitusstudent
2019 Mar 28, 5:27pm
I dislike "technical analysis" but this is one chart is fucking ugly:

38
CBOEtrader
2019 Mar 28, 7:03pm
EBGuy says
Are you calling for a dollar crash? Are you loaded up on mortgages?
Perhaps an XRP play if you really think the global exchange system could collapse
This situation is nearly unfixable, so when the house of cards comes down it will blow out spectacularly.
Are you calling for a dollar crash? Are you loaded up on mortgages?
Perhaps an XRP play if you really think the global exchange system could collapse
39
 Shaman
2019 Mar 28, 7:23pm
Shaman
2019 Mar 28, 7:23pm
Heraclitusstudent says
To me this looks like a trailing indicator. By January 2009, the stock markets had reached close to their low points after falling all 2008. The nadir is after January. So honestly, this would be shit for predictive value. Looking back, the 2001 nadir wasn’t predictive either.
If anything, the bottom on this graph would indicate that there’s six months until the recovery.
Appendix A: In 7 out of 9 past times this indicator fell to 0, recession ensued.

To me this looks like a trailing indicator. By January 2009, the stock markets had reached close to their low points after falling all 2008. The nadir is after January. So honestly, this would be shit for predictive value. Looking back, the 2001 nadir wasn’t predictive either.
If anything, the bottom on this graph would indicate that there’s six months until the recovery.
40
 AD
2019 Mar 28, 8:36pm
AD
2019 Mar 28, 8:36pm
Heraclitusstudent says
Yes, basically the S&P 500 has moved sideways for the last 14 months. Notice the S&P 500 moved sideways for about 12 months prior to the late 2008 crash.
Seems like not much left to keep the market propped up around 2800 points for S&P 500. And technically the market was in a bear market back on December 24 when the S&P 500 was down 20% from its recent peak, as well as the other major indices below 20% of their recent peaks.
I dislike "technical analysis" but this is one chart is fucking ugly:
Yes, basically the S&P 500 has moved sideways for the last 14 months. Notice the S&P 500 moved sideways for about 12 months prior to the late 2008 crash.
Seems like not much left to keep the market propped up around 2800 points for S&P 500. And technically the market was in a bear market back on December 24 when the S&P 500 was down 20% from its recent peak, as well as the other major indices below 20% of their recent peaks.
41
Heraclitusstudent
2019 Mar 28, 11:12pm
Quigley says
We are probably not at the bottom, and we probably already passed the stock market peak.
But you are right. I wouldn't bet anything based on this indicator.
Rather my reasons are the exhaustion of the current expansion:
- housing is exhausted
- the unemployment pool is exhausted
- the tax break is exhausted.
- The feds already raised rate enough to inverse the yield curve.
The slightest slowdown now will build on itself: you will see more layoffs, sentiment and spending will go down, etc, etc...
No financial crisis this time around - in the US at least.
If anything, the bottom on this graph would indicate that there’s six months until the recovery.
We are probably not at the bottom, and we probably already passed the stock market peak.
But you are right. I wouldn't bet anything based on this indicator.
Rather my reasons are the exhaustion of the current expansion:
- housing is exhausted
- the unemployment pool is exhausted
- the tax break is exhausted.
- The feds already raised rate enough to inverse the yield curve.
The slightest slowdown now will build on itself: you will see more layoffs, sentiment and spending will go down, etc, etc...
No financial crisis this time around - in the US at least.
42
 cmdrda2leak
2019 Mar 29, 7:44am
cmdrda2leak
2019 Mar 29, 7:44am
Alternative viewpoint:
Yield Curve Inversion Suggests New All-Time Highs For Stocks


https://seekingalpha.com/article/4251345-yield-curve-inversion-suggests-new-time-highs-stocks?ifp=0
Yield Curve Inversion Suggests New All-Time Highs For Stocks
As most readers of this article are probably aware, the 10-year minus 3-month US Treasury yield curve has recently "inverted." There has been a flood of commentary in the financial media (including over 20 articles on Seeking Alpha) with pundits claiming that this inversion "signal" portends an imminent recession in the US and that this forthcoming recession portends an associated major decline in the stock market.
At the very outset of this article, I want to make it clear that my detailed research suggests that the 10Y-3M yield curve is not a good predictor of recessions. Nor is it a good indicator of draw-down risk in an investment portfolio.
This signal extracted from this particular yield curve, based on inversion, generated some false positives in the mid-1960s, many false positives all throughout the 1980s and 1990s, and a false positive around 2005. Furthermore, using inversions of this yield curve as a "sell" signal in an asset allocation model would have produced many trading "whipsaws" and poor investment performance.
So which, if any, yield curve should be used for purposes of recession forecasting? Many different yield curves - there are hundreds of possible maturity combinations that can be used - could be used to extract a recession signal that is derived from inversion of that particular curve. As it turns out, researchers have discovered that inversion of the 10Y-3M yield curve has apparently been - and I use this term intentionally - a pretty good lead indicator of recessions.
Proponents of the 10Y-3M yield curve inversion signal frequently claim that this indicator has predicted 7 out of the last 7 recessions. While this statement is arguably accurate, it can be a bit misleading unless it is qualified. First of all, using daily price data, the 10Y-3M yield curve produced a false negative in the late 1950s. Second, as can be seen from Figure 2 above, the 10Y-3M yield curve inversion signal produced false positives in 1966, 1998, and early 2006. If these four failures were taken into account, the track record of the 10y-3M yield curve inversion signal would only be 4 of 8. Proponents of the 10Y-3M inversion signal generally suppress the latter two false positives by using monthly or quarterly data. Although this practice is questionable, for purposes of this article, we will go along with this assumption. Using these criteria, the 10Y-3M inversion signal has a track record of 6 out of 8 - and 6 out of the last 6. This seems like a reasonably good track record for a leading indicator, from a purely statistical point of view.
But there is a critical question that is rarely if ever asked: Is there any solid theoretical or conceptual basis for using the 10Y-3M yield curve to forecast recessions? Is there any solid theoretical or conceptual basis for preferring this yield curve to any other yield curve? The answer to this question is: No, there isn't. As I will be discussing at length in Successful Portfolio Strategy in the next few days and weeks, from a conceptual point of view, there is very little theoretical or conceptual support for using yield curves at all to predict recessions. Furthermore, to the extent that yield curves are used at all for predicting recessions, there is definitely good conceptual reasons to use yield curves other than the 10Y-3M.
[...]
What Has Historically Happened to The Economy and Stocks After the 10Y-3M Yield Curve Inverts?
Although there is little or conceptual justification for using the 10Y-3M yield curve as a basis for predicting recessions within a 6-to-18-month timeframe, we will play dumb for now and simply take this indicator at face value in the way that it is employed by most of its proponents - i.e. as a leading indicator of recessions. What has historically happened in each of the last 8 business cycles after the first inversion of the 10Y-3M yield curve? Note that we use monthly data in Figure 3 below in order to filter out false positives in 1998 and early 2006.
Let's first look at what has historically occurred to the economy after the 10Y-3M yield curve has registered its first inversion of the business cycle. The first thing to note is that the range of outcomes is quite wide. From the date of the first yield curve inversion in a cycle until recession, the time elapsed ranges from 4 years to 6 months. Including only the past 6 cycles, the range is 17 to 6 months.
Now, let's look at what has historically occurred to stocks during this time. The first thing to observe is that cyclically-associated bull markets tend to continue trend higher for some time after the inversion of the 10Y-3M yield curve. The median time from the inversion until the end of the cyclically-associated bull market (and the start of a cyclically-associated major drawdown) was about 11 months. The median upside of the S&P 500 until the peak of the cyclically-associated bull market cycle is reached was 16.03% (not including dividends).
The implication that can be derived from this analysis of the historical data is that a yield curve inversion does not signal an immediate end to the US economic expansion. Most importantly, the inversion does not signal an immediate end of an ongoing cyclically-associated bull market. Indeed, historical precedent suggests that after an inversion of the 10Y-3M yield curve, the S&P 500 is likely to register fairly significant upside until the peak of the cyclically-associated bull market is reached.
[...]
However, if one believed that the 10Y-3M inversion signal was significant, and took it at face value, this is how I would go about thinking about how to apply it to the present situation:
The data on yield curve inversions is divided into two categories: A) Yield curve inversions that happened before major cyclically-associated drawdowns; B) Yield curve inversions that happened after major cyclically-associated drawdowns. As stated earlier, major cyclically associated drawdowns have always occurred after the 10y-3M yield curve has inverted - unless there has been a major macroeconomically significant shock which has imperiled the economic expansion.
[...]
Relating this to present circumstances, it should be noted that there have been no major macroeconomically significant shocks that have imperiled the ongoing business cycle (and which the yield curve failed to properly discount). Therefore, the current situation of the US stock market most likely falls under the first category of yield curve inversions - the US stock market is in a situation in which the end of the cyclically associated bull market is likely to occur significantly after the 10Y-3M yield curve has inverted.
How much after the inversion of the 10Y-3M can we expect the current cyclically associated bull market to end? Based only on the historical experiences with yield curve inversions, a reasonable expectation would be about 11 months, with a pretty wide margin of error.
[...]
https://seekingalpha.com/article/4251345-yield-curve-inversion-suggests-new-time-highs-stocks?ifp=0
43
Heraclitusstudent
2019 Mar 29, 9:50am
The articles you get for free are often there to herd you into buying or selling.
At the top of the market they usually sounding like:
"CSCO is a much better buy than ORCL: look at the numbers.". (implicit: you should be buying)
"The yield curve inverts? Don't worry, this is not a good predictor."
Nothing that is free is on your side.
At the top of the market they usually sounding like:
"CSCO is a much better buy than ORCL: look at the numbers.". (implicit: you should be buying)
"The yield curve inverts? Don't worry, this is not a good predictor."
Nothing that is free is on your side.
44
clambo
2019 Mar 29, 3:07pm
Cash is for paying for immediate emergencies, fun money, vice money and bait for females.
I'll never get out of stocks unless and until I see Warren Buffet sell everything.
Dividend paying stocks will always be OK; when will people give up using soap and shampoo, gasoline, fast food, cell phone service, cable TV, electricity, credit cards and banks?
I'll never get out of stocks unless and until I see Warren Buffet sell everything.
Dividend paying stocks will always be OK; when will people give up using soap and shampoo, gasoline, fast food, cell phone service, cable TV, electricity, credit cards and banks?
45
Heraclitusstudent
2019 Mar 29, 3:36pm
Buy and hold is great: the Dow was at 10,000 in 99 then again in 2004, then again in 2008, then in 2011, with a couple of trips to 8000 in between.
But we moved on... Dow 25,000 is the new baseline.... It will do x2.5 again soon.
But we moved on... Dow 25,000 is the new baseline.... It will do x2.5 again soon.
46
clambo
2019 Mar 29, 4:05pm
Everyone focuses on the value of the indices while not counting the compounding dividend effect which over time is tremendous.
I remember when the Dow was 4000 and they said it was far too high and ready to crash.
I follow the W5000 index anyway.
When I look at my stock mutual funds over decades, I see a significant % of the increase was actually dividends. I'm not going to give that up.
I remember when the Dow was 4000 and they said it was far too high and ready to crash.
I follow the W5000 index anyway.
When I look at my stock mutual funds over decades, I see a significant % of the increase was actually dividends. I'm not going to give that up.
47
Heraclitusstudent
2019 Mar 29, 4:28pm
Ok I'll keep 8-10% in dividend stocks with DRIPs since Rin recommends it.
NAC gives me almost 5% tax free btw - though this return may go down with leverage now.
NAC gives me almost 5% tax free btw - though this return may go down with leverage now.
48
 rocketjoe79
2019 Mar 29, 9:02pm
rocketjoe79
2019 Mar 29, 9:02pm
And: Has the the Brexit Issue already been priced in, or will Brexit follies start a European downturn, followed by our own recession? This is an ugly uncertainty.
49
cmdrda2leak
2019 Mar 29, 9:12pm
clambo says
What are your favorite dividend holds? What do you think about non-dividend-pooping dividend ETFs like NOBL?
Everyone focuses on the value of the indices while not counting the compounding dividend effect which over time is tremendous.
I remember when the Dow was 4000 and they said it was far too high and ready to crash.
I follow the W5000 index anyway.
When I look at my stock mutual funds over decades, I see a significant % of the increase was actually dividends. I'm not going to give that up.
What are your favorite dividend holds? What do you think about non-dividend-pooping dividend ETFs like NOBL?
« First « Previous Comments 10 - 49 of 73 Next » Last » Search these comments
I think the best we can hope at this point is 1 year of slow growth and a volatile market before some kind of recession.